Table of Contents
Past locations
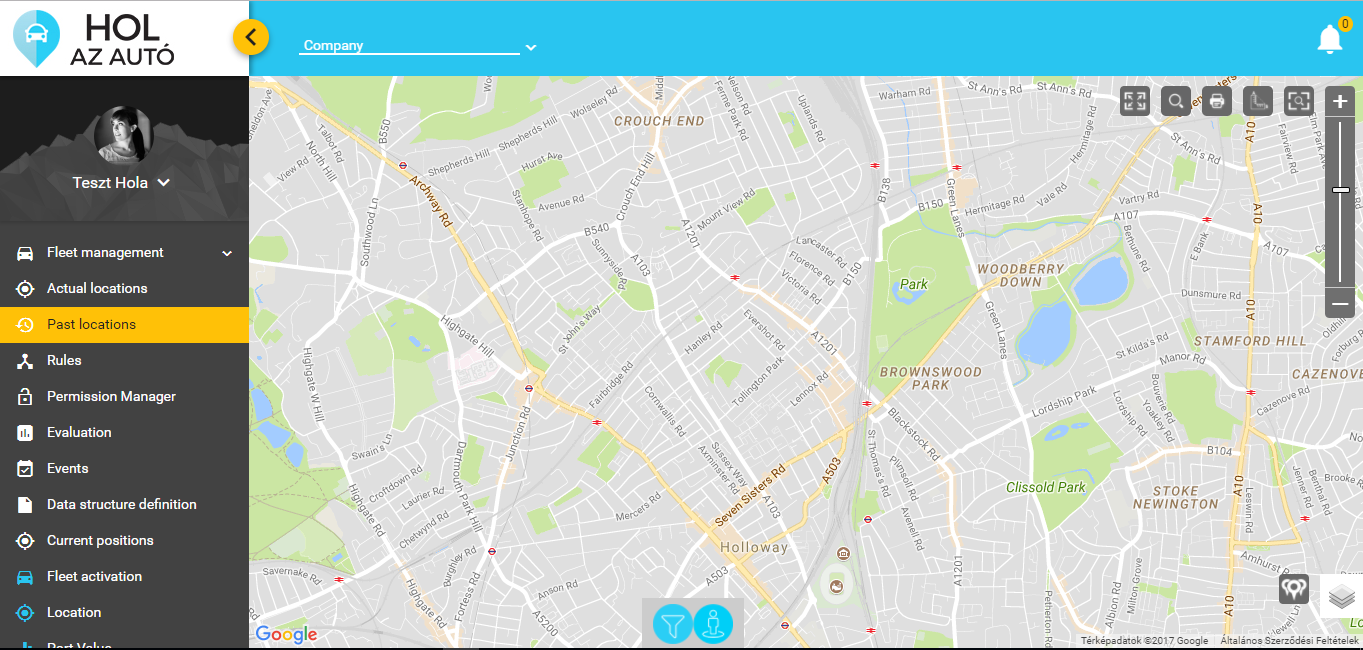
This part of the application has been designed to evaluate the positions, routes and port values of the given device in the past. Those map functions which are used on all map interface, are explained here.
Configuration
By clicking on the icon in the dock, the configuration window opens. In here, the device’s past positions, routes, and reported port values can be searched in a given timeframe, such as speed, RPM, fuel level, odometer standing and many more values, depending on the vehicle and device type, and also on the configuration. When looking up one device, all port types can be analyzed, if two or more devices are selected, only one port type can be requested. The loading speed of the report depends on the number of the chosen devices, port types and the the length of the queried timeframe.
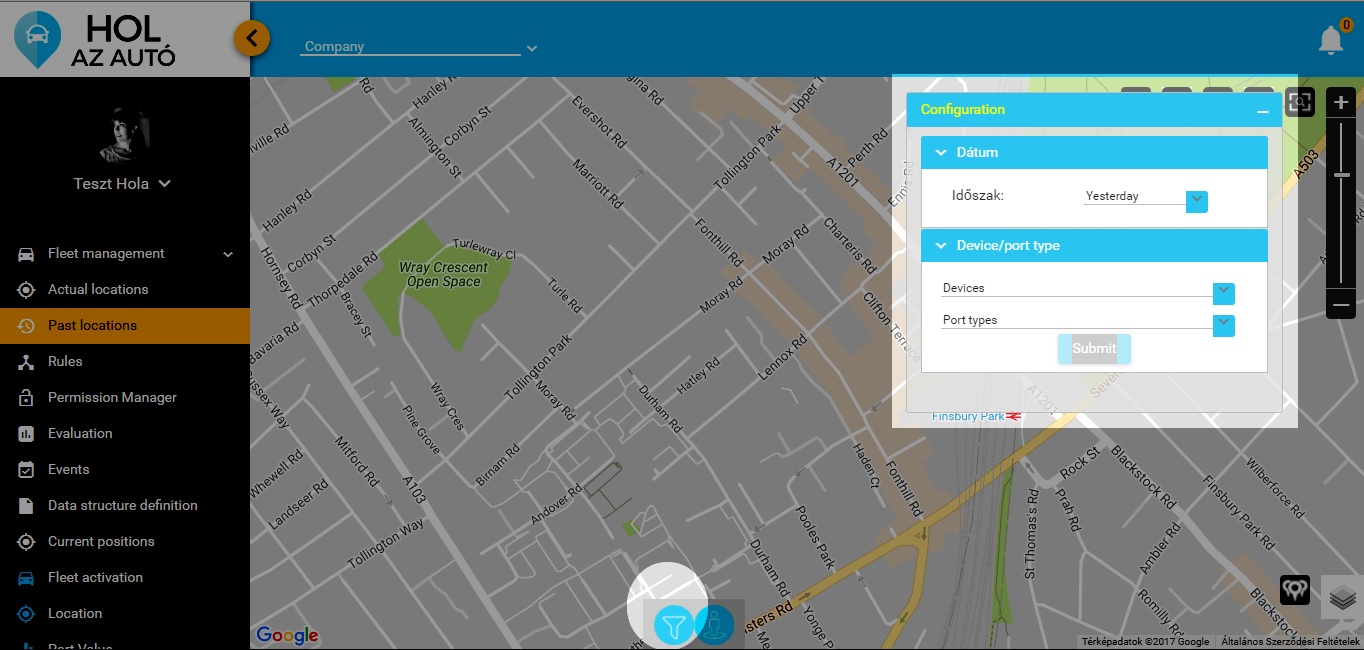
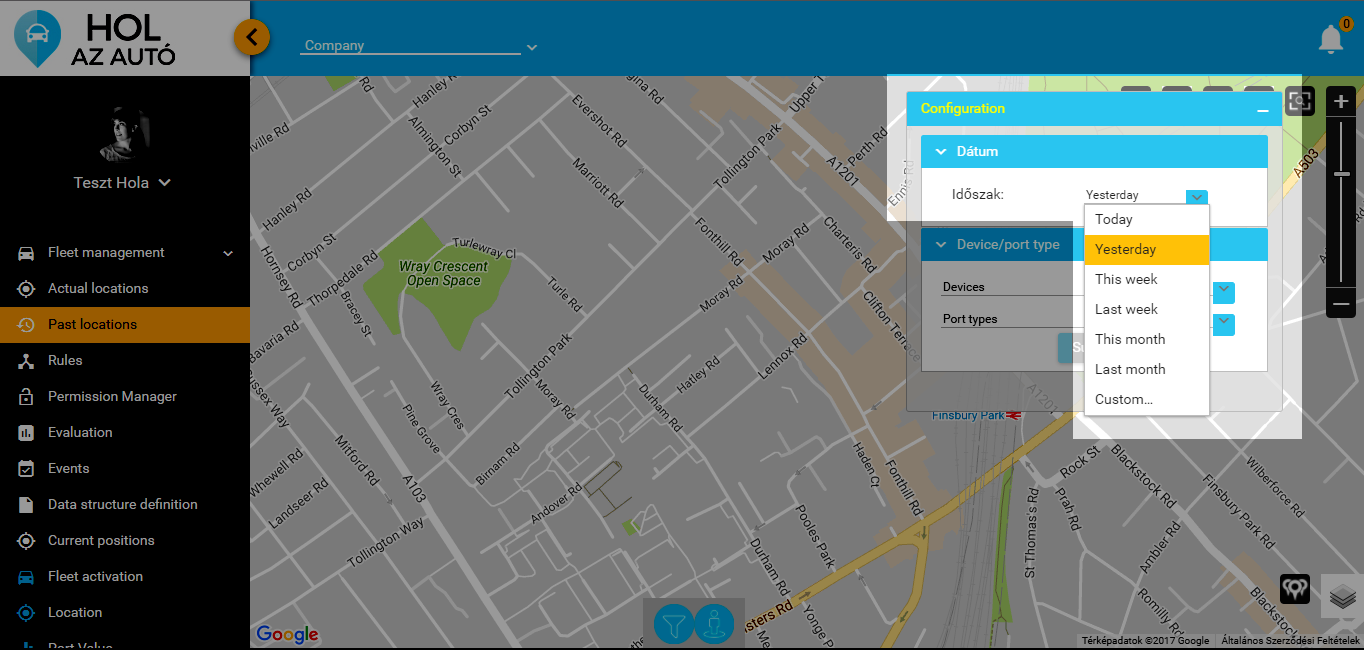
Frequently used, predefined intervals can be chosen from a drop-down list in the Date field of the Configuration window, alternatively the start and end date can be set on demand as well.
The devices and the related port types to be evaluated can be chosen in the Devices

and Port Types fields of the Configuration window.
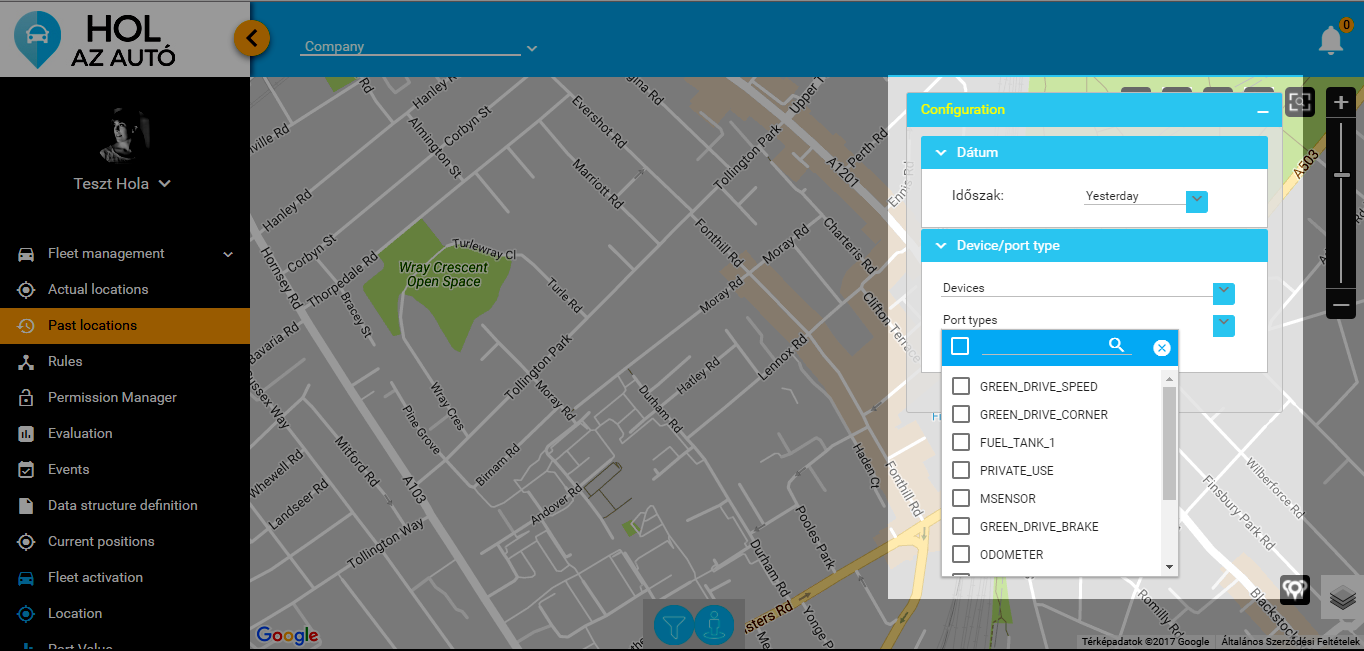
Report
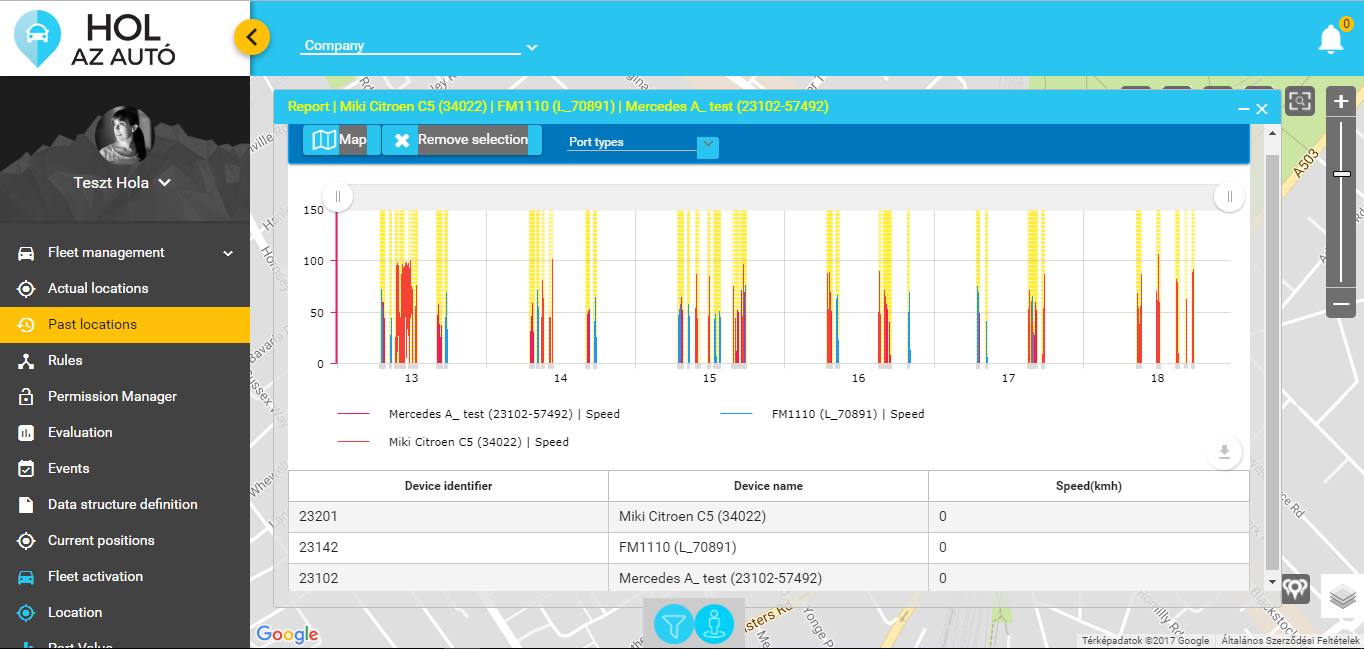
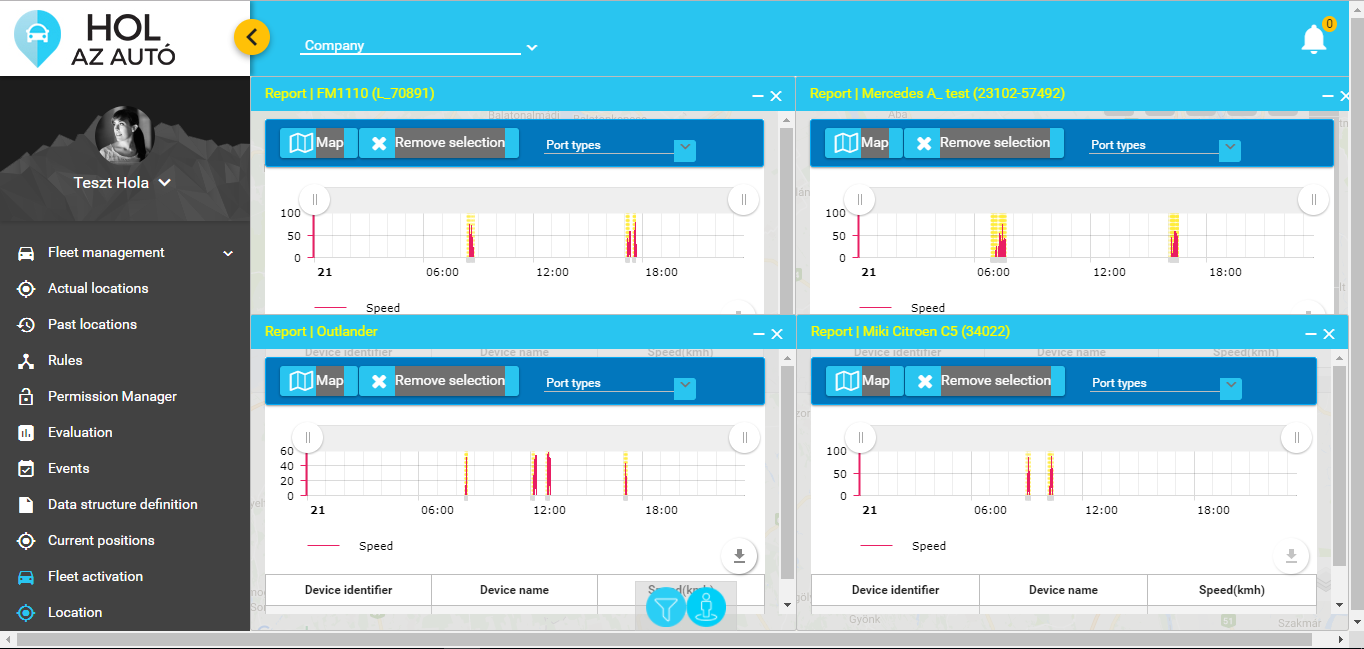
The report will be displayed on a graph after clicking on the Execute button, which becomes available as soon as there is a chosen value in each configuration field. In case the configuration is incorrect, (i.e. several port types are chosen when demanding information about two or more devices) the button remains unavailable. The related port types of the selected device are displayed in the opening window; if only one device is picked, the number and combination of the shown port types can be changed after opening the report window too.
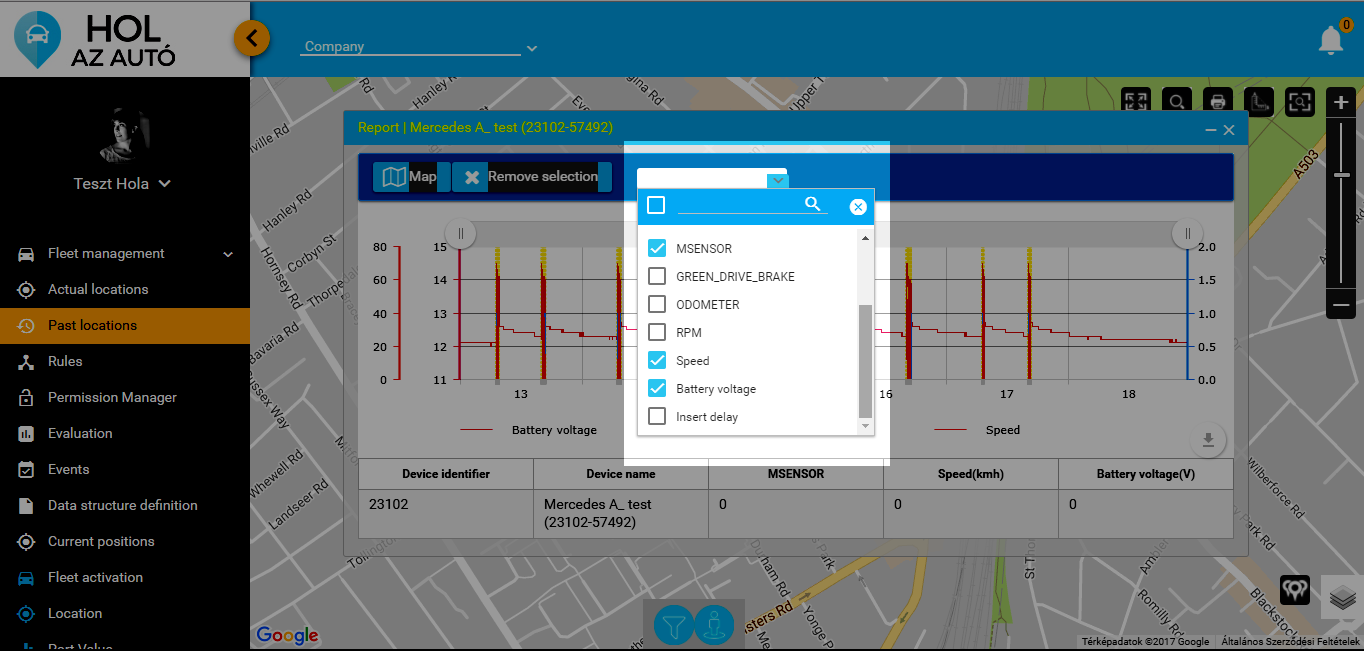
It is possible to zoom onto a shorter interval in the graph by moving the two round buttons in the top corners horizontally, the same result can be achieved by clicking in the graph and keeping the button engaged whilst moving the mouse horizontally. With a single click anywhere in the graph, a date can be marked.
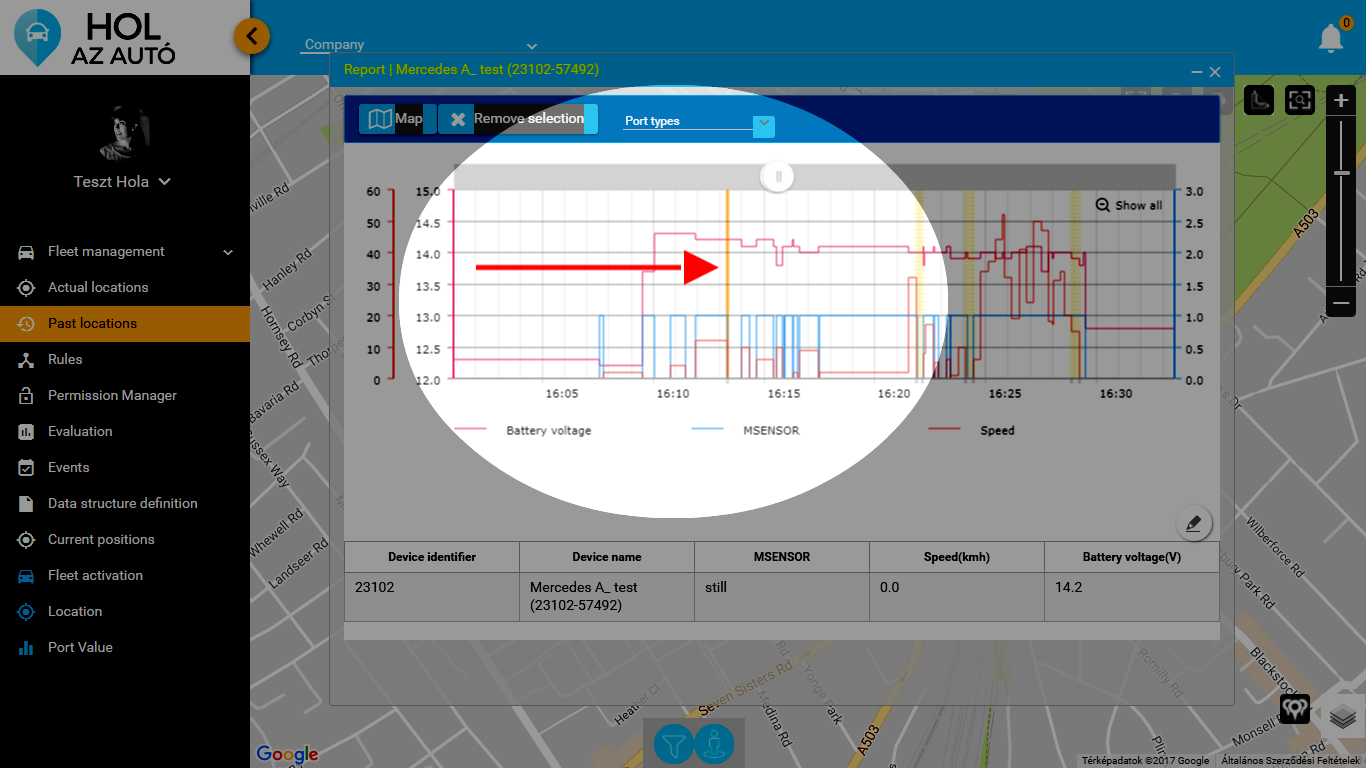
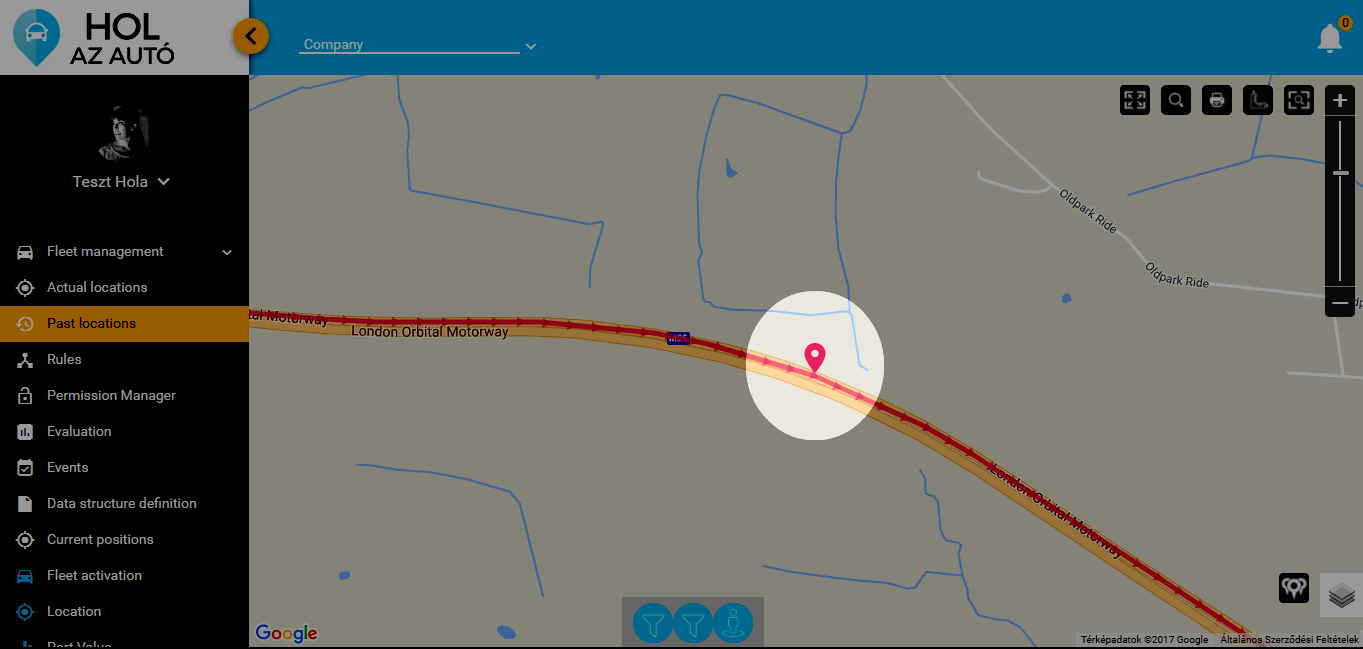
The marked date and the route made under the evaluated timeframe can be displayed on the map with the Map button, located in the top left corner of the window. In case there was no marked date on the graph, a click on the track displayed on the map will generate a mark on the graph, then the date and time can be read when hovering the mouse over the appearing mark.
The identification and name of the device and the related port types can be found in the table under the graph, the explanation of the colour code of the shown port type is placed between the graph and the table. The port value can be deactivated and reactivated on the graph by clicking on the colour code legend.
Using the Download button there are four options to choose from:
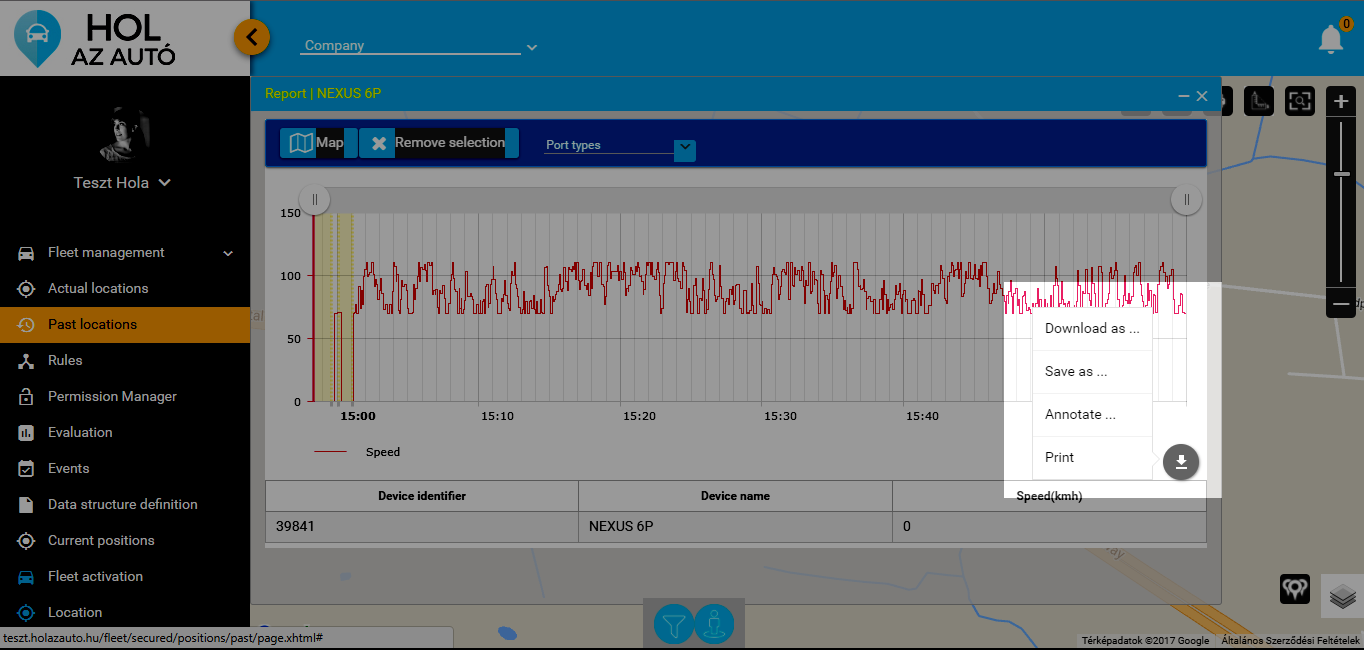
- Download (in PNG, JPG, SVG, PDF formats)
- Save (in CSV, XLSX, JSON formats)
- Annotate (mode (draw, line, arrow), insert shapes and text, colour, opacity, size)
- Print
The Show all button zooms out to the entire graph by leaving the marked date in the graph, the Delete Mark button will zoom out too, however, it will delete the datemark also. After zooming out or deleting the mark, a new interval can be zoomed into, or a new datemark can be pinned in the graph.
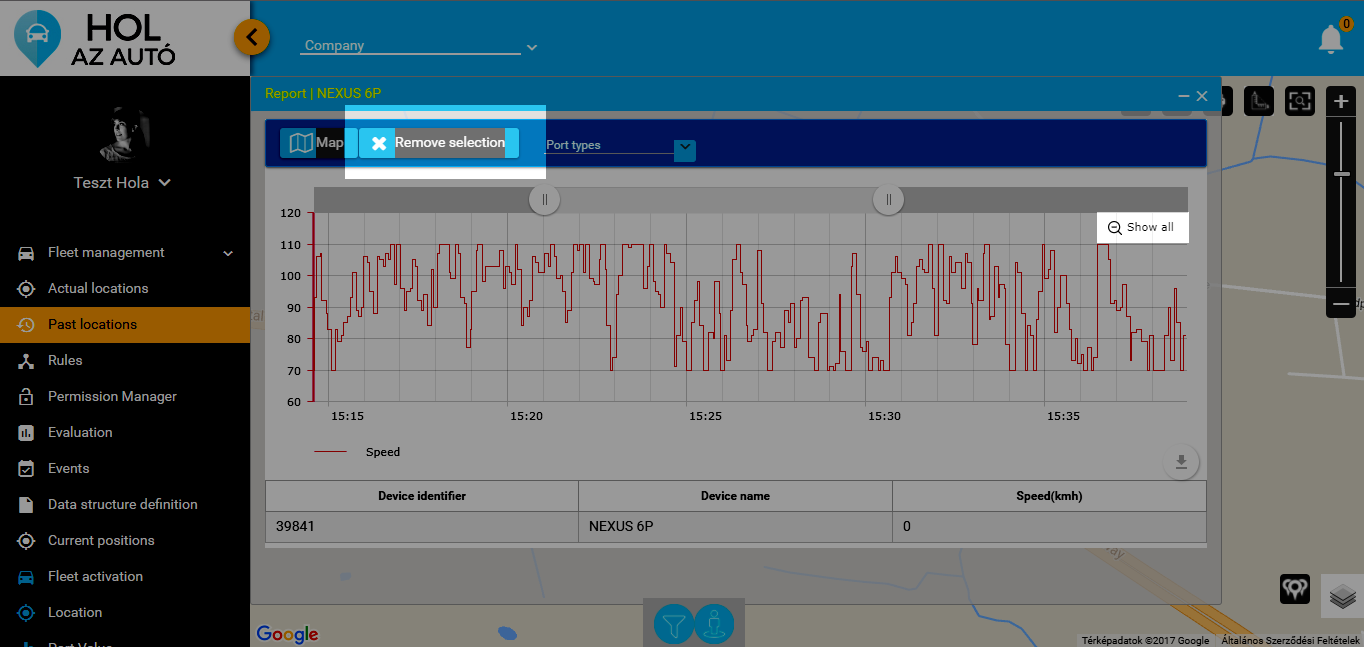
Several reports can be displayed at any time, each of them will open up in a separate window.
