Table of Contents
Driving behaviour
Overview
Our users can analyze their drivers' driving style, and the drivers' compliance with traffic regulations within a pre-defined time interval.
Configuration and evaluation
Configuration
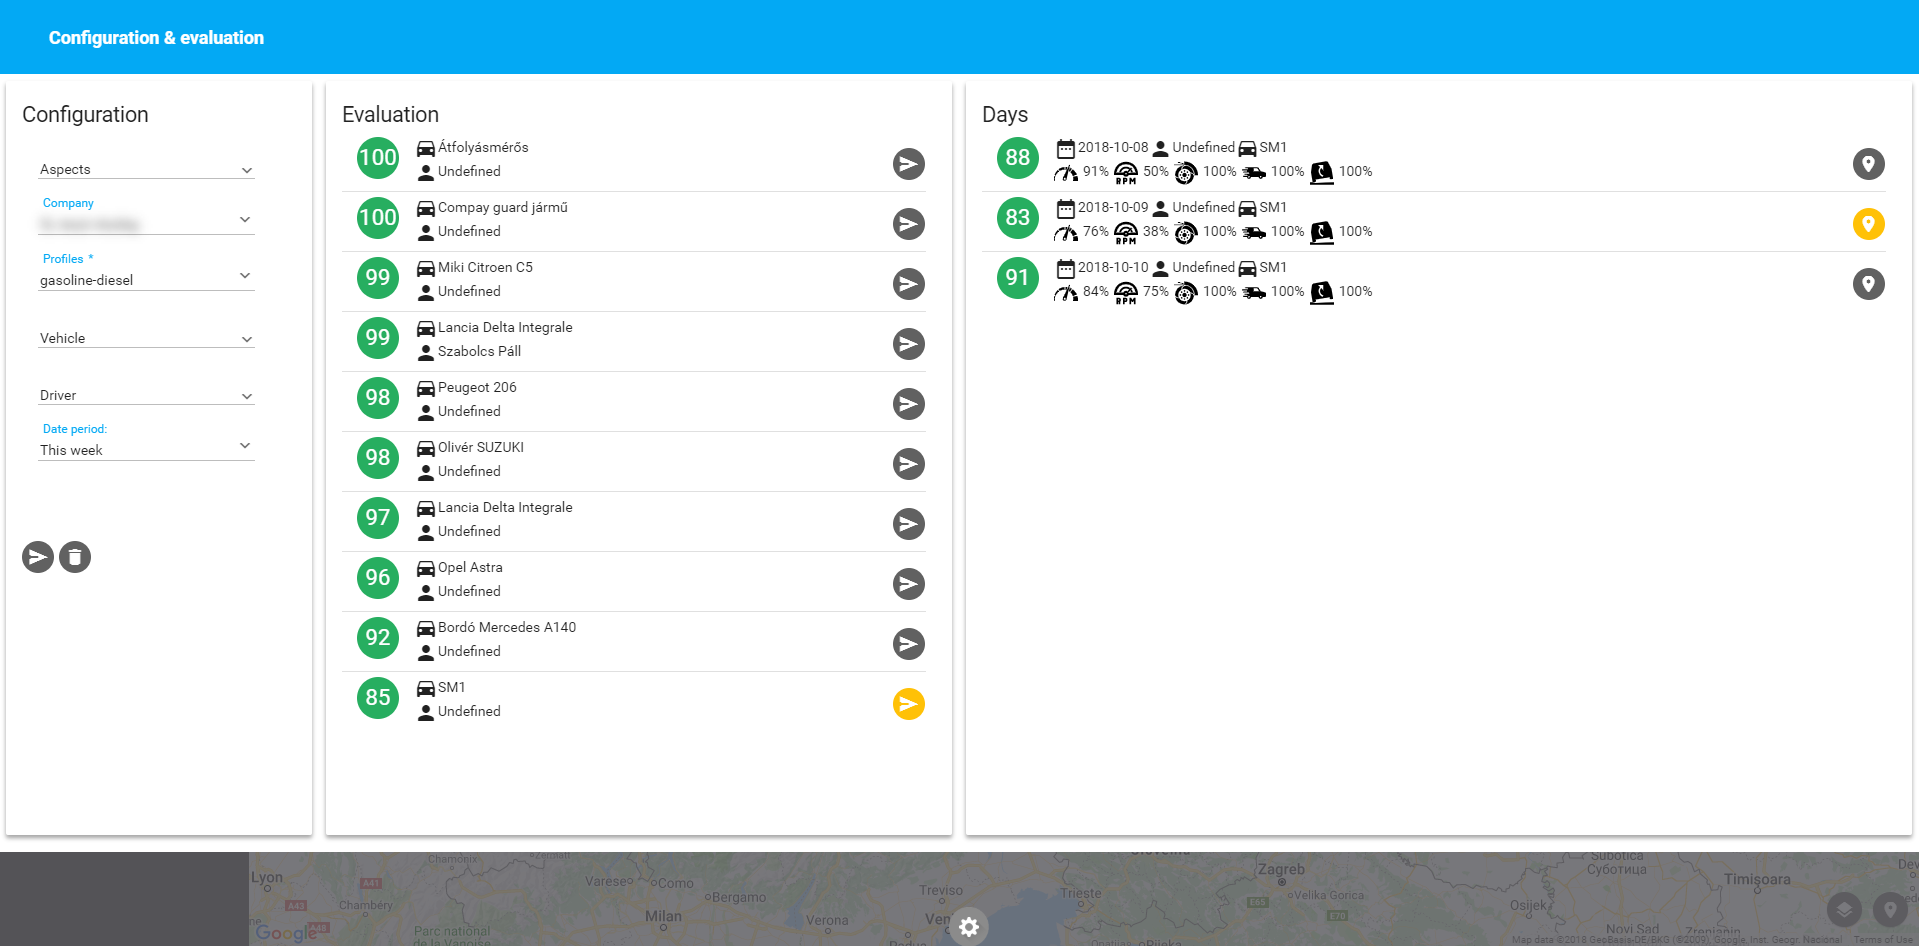
The function's opening screen is the Configuration and evaluation window. The evaluation's aspects can be selected on the left side of the widow, the following aspects are available:
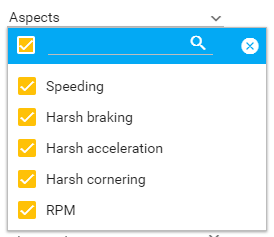
- Speeding
- Harsh braking
- Harsh acceleration
- Harsh cornering
- PRM
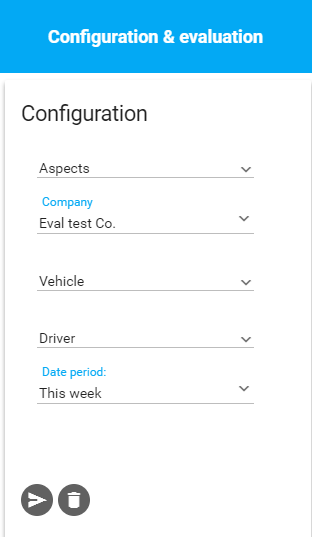
The next step is - if the user is concerned in several companies - to choose the company, then to select the evaluated vehicles and to set the time interval. The querie starts by clicking on the Evaluation button.
Profiles
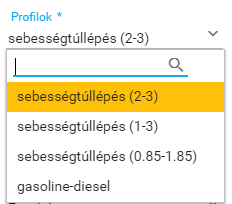
Based on individual or company demand, different evaluation profiles can be set. These profiles are configured based on the occuring needs, and are available in a drop down list, in the configuration panel, below the company selector. When creating such a profile, the aspect's qualification levels' limits, and the weighting of the aspect is adjustable too.
This way, cars and lorries can be evaluated using different profiles. For example the motorway speed limits are different for cars (80mph) and for lorries (70mph), so the profile for heavy goods vehicle will detect speeding above 70mph, while the profile for cars will detect speeding only above 80mph. Profiles can be created considering that vehicles running on gasoline usually are operating in lower RPM ranges, or considering the special characteristics of agricultural machinery.
The aspects of responsible and environmentally conscious driving are also available when creating a new profile, such as harsh braking, harsh acceleration and harsh cornering. Keeping these aspects in mind will make sure that the carried goods reach the destination in good condition.
The evaluation is uniformly based on 10 assessment level within every aspect.
After summarizing the result of all aspect, the driver receives a score between zero and one hundred, 100 being the best score. The use of color code makes the overview of the displayed results easy: 0-25: red, 25-50: orange, 50-75: yellow, 75-100: green.
Evaluation
The results are displayed by vehicles in the Evaluation section of the Configuration & Evaluation window. If a vehicle has been driven by more than one identified driver in the the investigated period, the result will be displayed by drivers regarding the vehicle too.
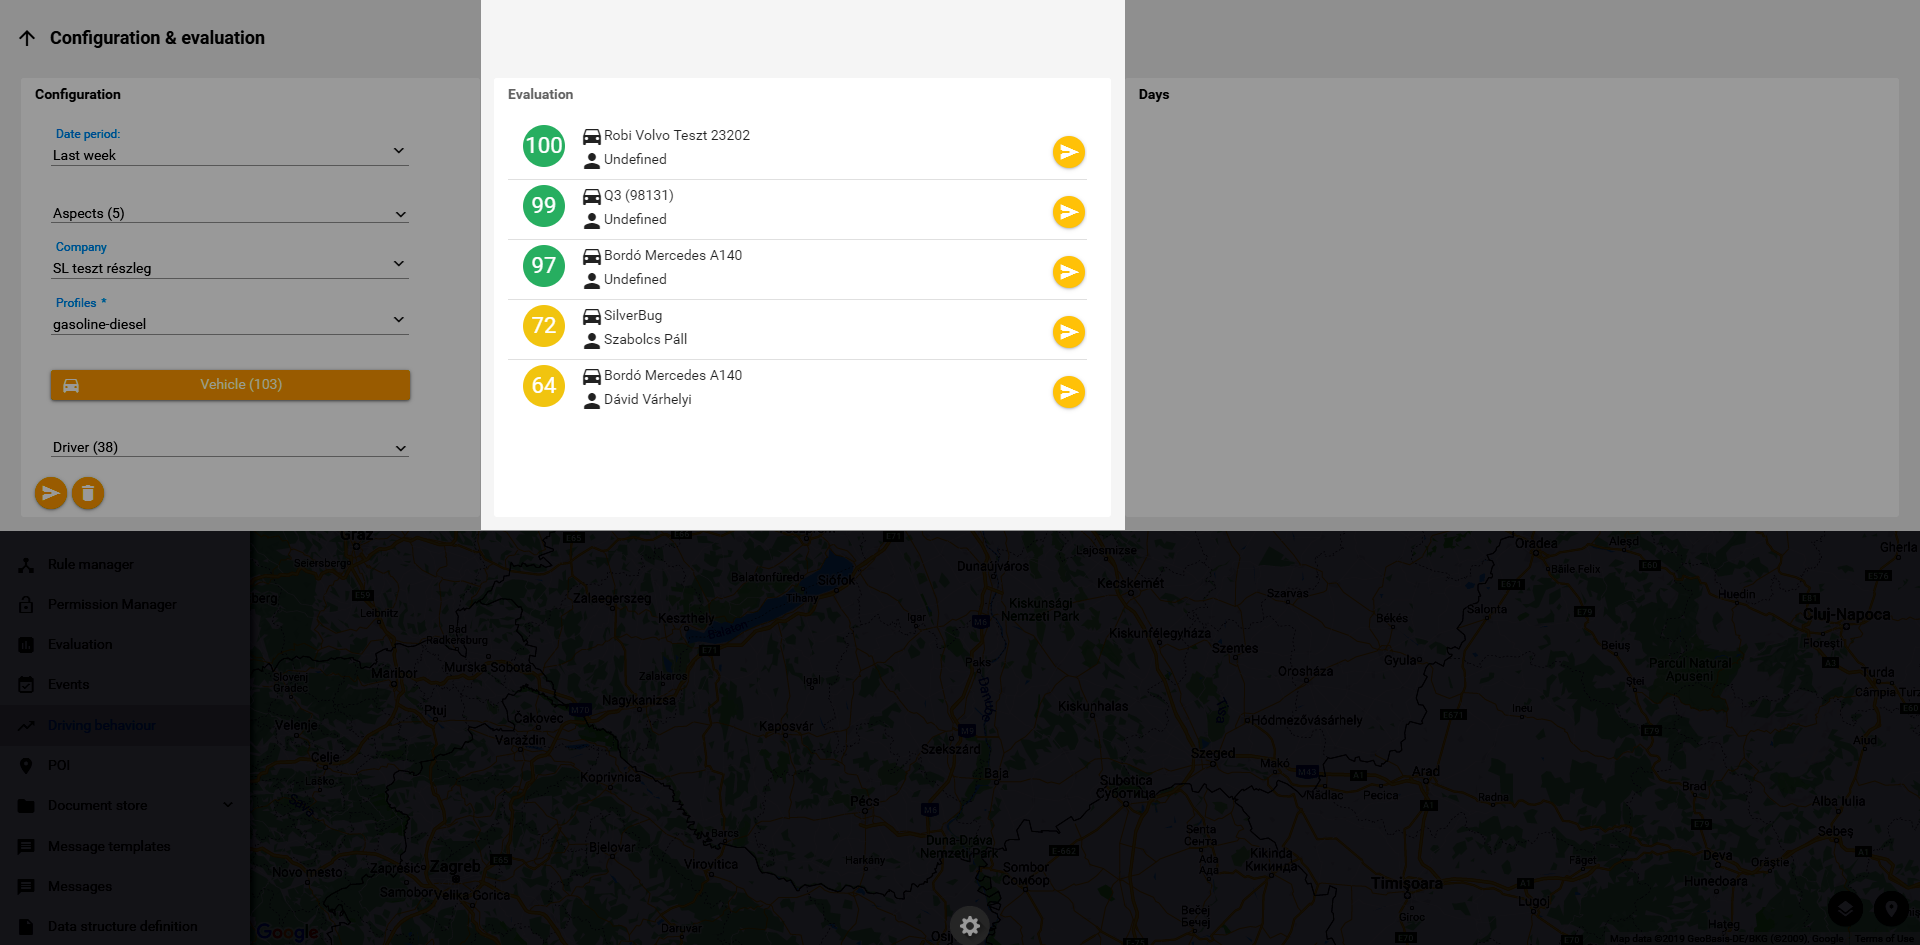
The overall score is indicated on the left side of the Evaluation window, highlighted with the corresponding colour code. This score is calculated by averaging the daily scores.
The vehicle's and the driver's name is indicated to the right of the overall score, a click on the arrow button at the right end of the row displays the investigated period day by day at the right, in the Days section.
The daily score is calculated by averaging the green drive result percentages. The system calculates using distance-weighted average, so if a driver exceeds the speed limit by 10 mph twice during a 20 mile route, means a worse score than the same speeding events during a 30 mile route.
Days
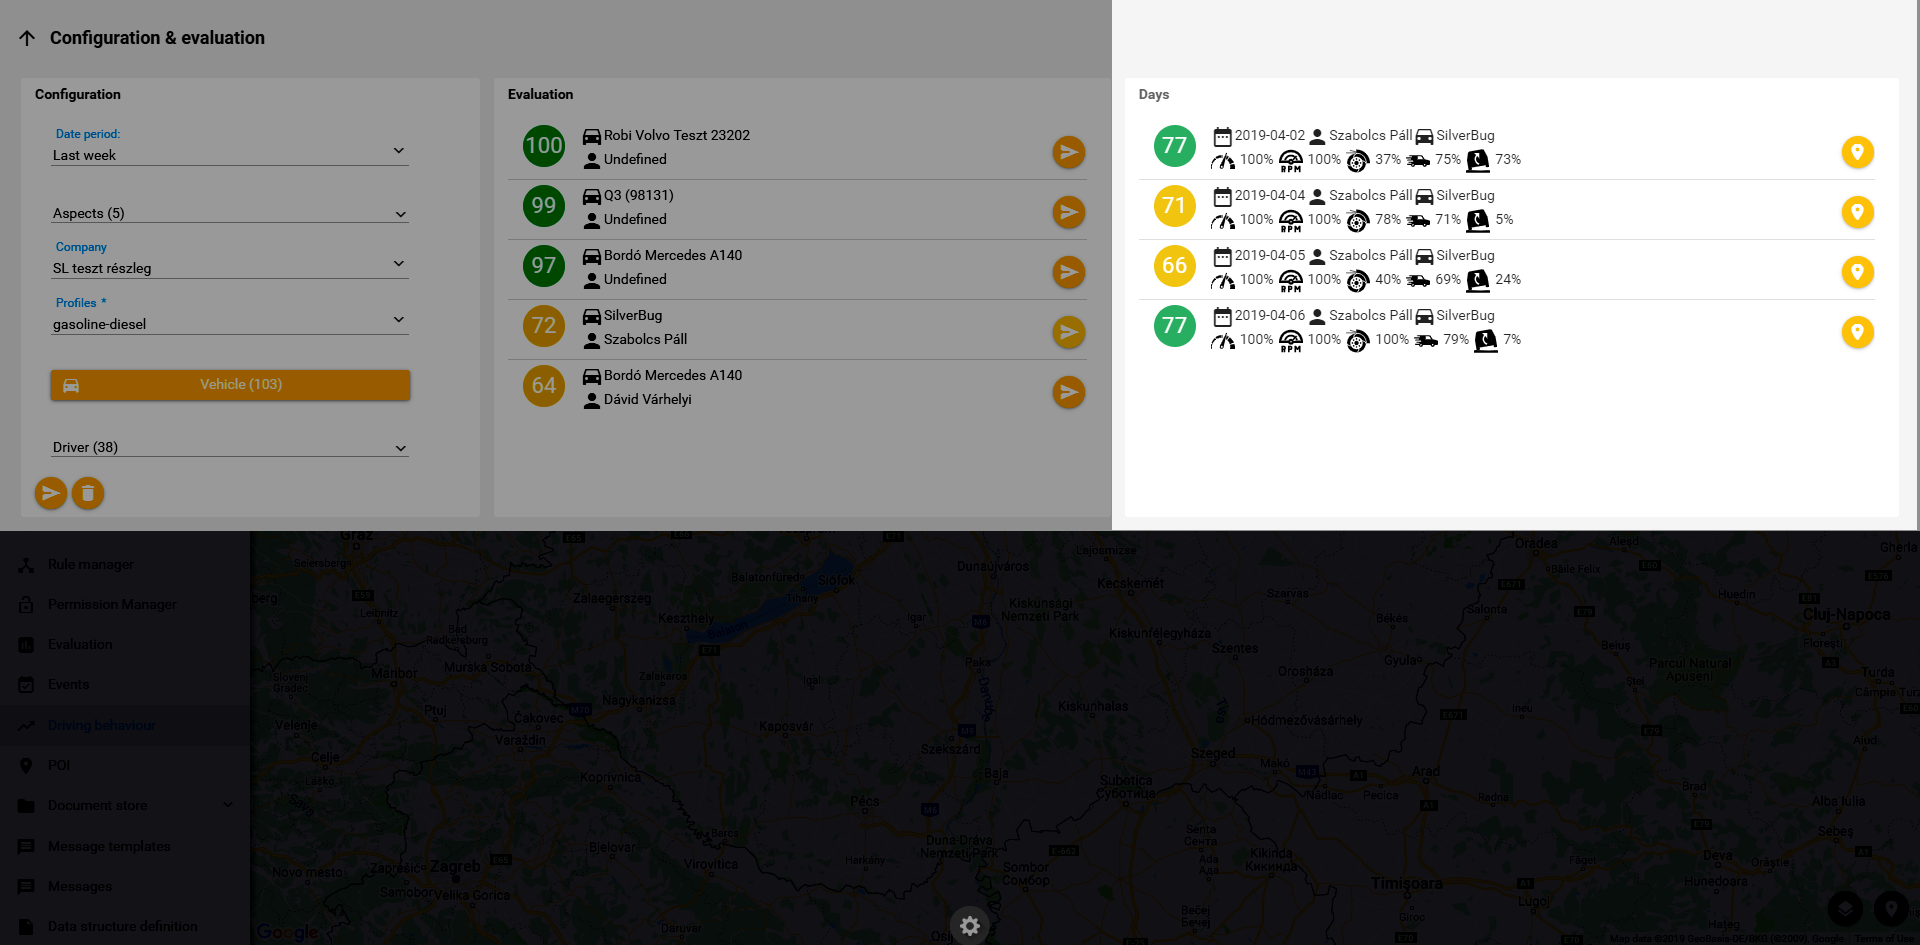
This view shows the daily score, the distance-weighted average of the green drive results. The daily score is displayed at the left end of the row, with the corresponding colour code. The date, the driver's and the vehicle's name is located to the right of the score, the green drive indexes are displayed below.
Representation on map
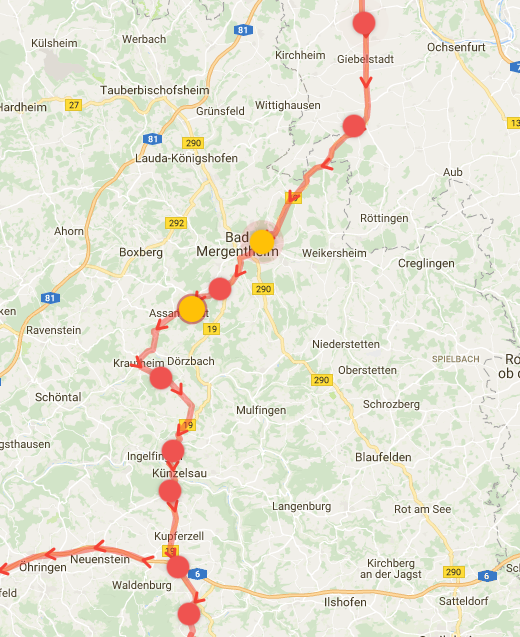
By clicking the button located at the right end of the daily view, the route made during the investigated period is displayed on the map, where the events detected on the basis of the selected green drive criteria are indicated by animated, pulsating indicators. The red indicators hide multiple events. Single events are marked with yellow indicators, and can be checked one by one by zooming in with a single click on the red indicator. The yellow indicators' size is proportional to the severity of the event, so a 30mph over-speeding means a larger indicator than a 10mph over-speeding.

